
Email marketing remains one of the highest-performing digital marketing channels in 2026. Despite the rise of AI-driven ads, social commerce, and short-form video, email continues to deliver measurable ROI, predictable engagement, and direct access to owned audiences.
But performance isn’t universal.
An open rate that looks “good” for a retail brand may be underperforming for a nonprofit. A bounce rate that’s acceptable in one region might signal deliverability problems in another. And the day or time you send your campaign can significantly impact results.
That’s where email marketing benchmarks come in.
Benchmarks provide real-world performance averages across industries, regions, and sending times. They give context to your metrics, helping you understand whether your campaigns are thriving, stagnating, or quietly underperforming.
In this 2026 update, we’ll break down:
-
Industry-specific open, click, unsubscribe, and bounce rates
-
Regional differences in engagement and deliverability
-
Best-performing days and times to send
-
Additional benchmarks like conversion rate and ROI
-
Practical ways to improve your performance
If you want to make smarter decisions based on data — not guesswork — this guide will give you the clarity you need.
Why Are Email Marketing Benchmarks Important?
Email marketing metrics in isolation are meaningless.
A 25% open rate sounds strong — until you realize your industry average is 38%. A 2% click-through rate may feel weak — until you discover it’s above your sector’s benchmark.
Benchmarks matter because they provide context.
Here’s why they are essential in 2026:
1. They Help You Measure True Performance
Without benchmarks, you’re comparing your results to assumptions. With benchmarks, you compare against real market averages. This helps you identify:
-
Underperforming campaigns
-
Healthy list engagement
-
Deliverability issues
-
Growth opportunities
Instead of asking “Is this good?”, you can ask “Are we outperforming our industry?”
2. They Reveal Industry-Specific Behavior
Audience behavior varies significantly by sector.
For example:
-
Nonprofits and hobby-based industries often see higher open rates.
-
Tech and SaaS brands may struggle more with unsubscribe and bounce rates.
-
Government and education emails tend to generate strong engagement due to informational relevance.
Understanding these patterns helps you set realistic expectations.
3. They Improve Strategic Decision-Making
Benchmarks guide:
-
Subject line optimization
-
Content format adjustments
-
Send-time experimentation
-
List hygiene improvements
-
Segmentation strategies
Instead of making blind changes, you can prioritize improvements where you lag behind the average.
4. They Protect Deliverability
Metrics like bounce rate, spam complaints, and unsubscribe rate directly affect sender reputation.
If your bounce rate exceeds accepted norms, inbox providers may throttle or block your emails. Benchmarks help you catch deliverability risks early before they damage your domain reputation.
5. They Justify Budget & ROI Discussions
Email marketing often competes with paid ads and social campaigns for budget. Benchmark data allows you to:
-
Demonstrate above-average engagement
-
Compare channel performance objectively
-
Prove email’s ROI potential
-
Set realistic performance KPIs
Benchmarks turn email marketing from a guessing game into a measurable, scalable growth channel.
Email Marketing Metrics by Industry
Here’s how different industries perform in 2026 based on aggregated campaign performance data across millions of emails.
| Industry | Open Rate | Click-through Rate | Unsubscribe Rate | Bounce Rate |
|---|---|---|---|---|
| Advertising & Marketing | 28.99% | 1.62% | 0.12% | 0.27% |
| Agriculture & Food Services | 35.66% | 2.92% | 0.18% | 0.30% |
| Education & Training | 35.91% | 3.10% | 0.14% | 0.31% |
| Business & Finance | 35.13% | 2.21% | 0.16% | 0.35% |
| Government & Politics | 38.36% | 2.95% | 0.11% | 0.33% |
| Healthcare Services | 33.99% | 2.52% | 0.20% | 0.44% |
| IT / Tech / Software | 31.42% | 1.86% | 0.23% | 0.66% |
| Media & Publishing | 32.39% | 3.23% | 0.14% | 0.21% |
| Nonprofit | 40.39% | 3.46% | 0.10% | 0.41% |
| Other | 21.31% | 2.55% | 0.16% | 0.40% |
| Professional Services & Consulting | 34.11% | 2.28% | 0.17% | 0.54% |
| Architecture & Construction | 38.24% | 2.96% | 0.20% | 0.83% |
| Retail | 29.10% | 2.04% | 0.18% | 0.31% |
| Hobbies & Leisure | 40.12% | 3.55% | 0.16% | 0.21% |
| Wellness & Fitness | 35.29% | 2.84% | 0.26% | 0.32% |
| Real Estate | 31.15% | 2.08% | 0.15% | 0.36% |
| Telecommunications | 27.84% | 2.78% | 0.10% | 0.34% |
| Computers & Electronics | 27.91% | 2.11% | 0.14% | 0.46% |
| Manufacturing | 29.07% | 3.28% | 0.18% | 0.84% |
| Creative Services & Agency | 37.11% | 2.39% | 0.25% | 0.82% |
What This Data Tells Us (In-Depth Industry Analysis)
Email performance varies dramatically depending on audience intent, buying cycle length, and content type. Let’s break this down strategically.
1. Highest Open Rates: Trust & Community-Driven Sectors
-
Nonprofit (40.39%)
-
Hobbies & Leisure (40.12%)
-
Government & Politics (38.36%)
-
Architecture & Construction (38.24%)
-
Creative Services & Agency (37.11%)
These industries benefit from one of three engagement drivers:
-
Emotional alignment (nonprofits)
-
Personal interest & passion (hobbies)
-
Public importance or policy relevance (government)
-
Niche B2B audiences (architecture, creative services)
When audiences feel personally invested, open rates rise significantly.
Key insight: Emotional or highly relevant content consistently outperforms transactional promotions.
2. Strongest Click-Through Rates: Content-Heavy & Information-Led Industries
Top CTR performers:
-
Hobbies & Leisure (3.55%)
-
Nonprofit (3.46%)
-
Manufacturing (3.28%)
-
Media & Publishing (3.23%)
-
Education & Training (3.10%)
These sectors typically provide:
-
Educational resources
-
Product catalogs
-
Event updates
-
Newsletters with multiple links
Higher CTR suggests audiences aren’t just opening emails — they’re actively exploring content.
Strategic takeaway: Multi-link formats and educational value increase engagement depth.
3. Industries Struggling With Engagement
Lower open rates:
-
Other (21.31%)
-
Telecommunications (27.84%)
-
Computers & Electronics (27.91%)
-
Advertising & Marketing (28.99%)
-
Retail (29.10%)
These sectors often rely heavily on promotional messaging, discounts, and high-frequency campaigns.
When inboxes become saturated, engagement declines.
Important pattern: Over-commercialization reduces curiosity and urgency.
4. Unsubscribe Rate Trends: Audience Fatigue Signals
Highest unsubscribe rates:
-
Wellness & Fitness (0.26%)
-
Creative Services & Agency (0.25%)
-
IT / Tech / Software (0.23%)
These industries often send:
-
Frequent product updates
-
Sales pushes
-
Feature announcements
When messaging becomes too frequent or overly product-centric, audiences disengage.
A healthy unsubscribe rate typically stays between 0.1%–0.2%. Anything consistently above 0.25% signals list fatigue.
5. Bounce Rate Concerns: Deliverability Risk Zones
Highest bounce rates:
-
Manufacturing (0.84%)
-
Architecture & Construction (0.83%)
-
Creative Services & Agency (0.82%)
-
IT / Tech / Software (0.66%)
These are heavily B2B industries.
B2B lists experience:
-
More job changes
-
Company email deactivations
-
Higher data decay
If bounce rates exceed 0.5% regularly, you should improve:
-
List cleaning frequency
-
Email verification
-
Re-engagement suppression
6. Retail vs. Nonprofit: A Clear Contrast
Compare:
-
Retail Open Rate: 29.10%
-
Nonprofit Open Rate: 40.39%
The difference? Intent.
Retail emails are often promotional.
Nonprofit emails are mission-driven.
This highlights a critical 2026 strategy shift:
Storytelling and purpose-driven messaging outperform discount-heavy campaigns.
Some conclusions based on the data
-
Engagement is highest in passion-driven and community-focused industries.
-
B2B sectors face higher bounce risks due to database decay.
-
Promotional-heavy industries show lower open rates and moderate unsubscribe levels.
-
Educational and content-rich emails consistently achieve stronger CTRs.
-
Email fatigue is rising in tech, wellness, and agency sectors — frequency control is essential.
Most importantly:
There is no universal “good” metric.
Your performance must be evaluated against your industry average — not against general marketing assumptions.
Email Benchmark Metrics by Region
Now that we’ve learned how essential metrics vary by industry, let’s explore how performance changes across different regions. Geography influences inbox behavior, device usage, deliverability standards, privacy regulations, and purchasing power — all of which directly impact email results.
| Region | Opens | CTR | CTO | Unsubscribe | Spam Complaint | Bounces |
|---|---|---|---|---|---|---|
| North America | 23.53% | 3.86% | 0.1% | 0.1% | 0.01% | 3.42% |
| South America | 18.53% | 1.45% | 0.12% | 0.12% | 0.01% | 4.82% |
| Europe | 25.18% | 2.56% | 0.15% | 0.15% | 0.01% | 2.46% |
| Asia | 15.12% | 1.62% | 0.09% | 0.09% | 0% | 2.16% |
| Oceania | 19.59% | 1.57% | 0.11% | 0.11% | 0.01% | 1.75% |
| Africa | 16% | 1.05% | 0.09% | 0.09% | 0% | 1.95% |
| All Regions (Average) | 19.66% | 2.02% | 0.11% | 0.11% | 0.01% | 2.76% |
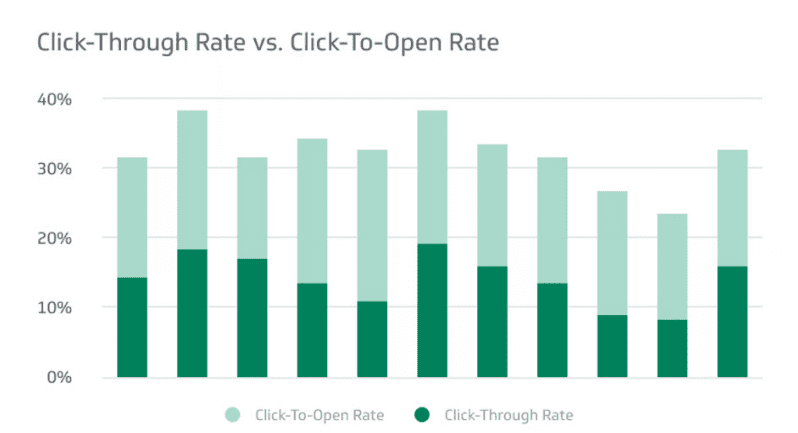
CTO = Click-To-Open Rate (percentage of people who clicked after opening).
Regional Performance Analysis (What the Numbers Really Mean)
1. Europe Leads in Open Rates
Europe records the highest open rate at 25.18%, outperforming the global average of 19.66%.
Why?
-
Strict consent regulations (e.g., GDPR-style opt-in culture)
-
Higher list quality due to double opt-in practices
-
Lower tolerance for unsolicited marketing
This indicates that European email lists are typically cleaner and more permission-based, which improves engagement quality.
2. North America Dominates Click-Through Rate
North America shows the strongest CTR at 3.86%, significantly above the global average of 2.02%.
This suggests:
-
Stronger promotional alignment
-
Mature email marketing ecosystems
-
Higher ecommerce adoption
-
Advanced segmentation and automation strategies
However, North America also has a relatively high bounce rate (3.42%), indicating potential list decay or aggressive list growth tactics.
3. South America Faces Deliverability Challenges
South America shows:
-
Lower open rate (18.53%)
-
Highest bounce rate (4.82%)
A bounce rate above 4% is considered high and may signal:
-
Aging databases
-
Inconsistent data validation
-
ISP filtering differences
Brands targeting this region should prioritize list hygiene and verification before scaling campaigns.
4. Asia: Lower Opens, Lower Complaints
Asia records:
-
Open rate: 15.12%
-
Spam complaints: 0%
-
Moderate bounce rate: 2.16%
Lower open rates may reflect:
-
Higher mobile messaging app usage (email not primary channel)
-
Cultural preference for app-based communication
-
Promotional oversaturation in certain markets
However, near-zero spam complaints suggest strong opt-in practices or lower complaint-reporting behavior.
5. Oceania & Africa: Balanced but Smaller Volumes
Oceania has the lowest bounce rate (1.75%), indicating excellent list health.
Africa shows moderate bounce rates (1.95%) but lower CTR (1.05%).
These markets may present growth opportunities, especially for brands willing to localize content and optimize for mobile-first audiences.
6. Global Average Perspective
Across all regions:
-
Open rate: 19.66%
-
CTR: 2.02%
-
Unsubscribe rate: 0.11%
-
Spam complaint rate: 0.01%
-
Bounce rate: 2.76%
If your campaigns significantly underperform these global averages, you likely have issues in:
-
List quality
-
Subject line effectiveness
-
Segmentation strategy
-
Deliverability setup (SPF, DKIM, DMARC)
-
Send-time optimization
Some conclusions based on the data
-
Regional behavior strongly impacts email performance — industry averages alone are not enough.
-
Europe demonstrates the highest-quality engagement through strong open rates.
-
North America excels in driving clicks but faces bounce-related challenges.
-
South America shows elevated bounce rates, requiring stronger list hygiene.
-
Asia and Africa have lower engagement rates but minimal complaint risk.
-
Bounce rates vary widely by region, reinforcing the need for geo-specific database management.
The key takeaway:
Global email strategy does not mean uniform email strategy.
If you send internationally, segmentation by region — including send time, language, and content positioning — is no longer optional in 2026. It’s essential for maximizing engagement and protecting deliverability.
Email Metrics by Day of the Week & Time
Timing can significantly influence email engagement. While content quality and segmentation remain critical, send-day and send-time optimization often deliver quick performance gains without changing your messaging.
Here’s how engagement varies across the week:
| Day | Opens | CTR | CTO | Unsubscribe |
|---|---|---|---|---|
| Monday | 22.0% | 2.3% | 10.6% | 0.1% |
| Tuesday | 21.8% | 2.4% | 10.8% | 0.1% |
| Wednesday | 21.8% | 2.3% | 10.7% | 0.1% |
| Thursday | 21.7% | 2.3% | 10.7% | 0.1% |
| Friday | 21.6% | 2.2% | 10.1% | 0.1% |
| Saturday | 20.5% | 2.1% | 10.1% | 0.1% |
| Sunday | 20.3% | 2.1% | 10.1% | 0.1% |
What This Data Reveals
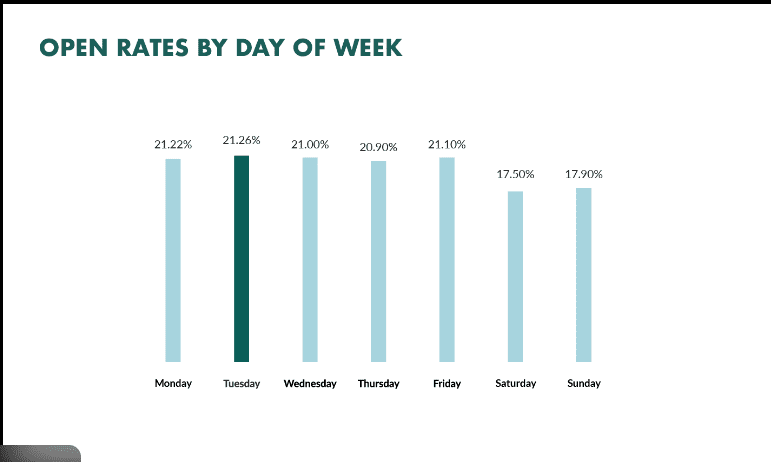
1. Weekdays Slightly Outperform Weekends
Open rates remain relatively stable Monday through Thursday (21.7%–22.0%), then gradually decline toward the weekend.
-
Monday has the highest open rate (22.0%)
-
Tuesday leads in CTR (2.4%) and CTO (10.8%)
-
Weekend engagement drops slightly but remains consistent
This indicates that inbox activity is more structured during workdays. Audiences are checking email as part of their daily routine.
However, the difference is not dramatic — meaning weekends can still perform well depending on your industry (especially ecommerce or hobby-related brands).
2. Tuesday Is the Strongest Click Day
Tuesday produces:
-
Highest CTR (2.4%)
-
Highest CTO (10.8%)
This suggests that audiences are not only opening emails early in the week — they’re also more likely to engage deeply.
Strategically, Tuesday often represents:
-
A stable work rhythm (not overwhelmed like Monday)
-
Active planning mindset
-
Higher attention span compared to Friday
For B2B brands, Tuesday and Wednesday remain the safest high-performance window.
3. Unsubscribe Rates Remain Stable Across the Week
Unsubscribe rates hold steady at 0.1% every day.
This shows that send-day alone does not significantly impact churn. Instead, unsubscribe behavior is more influenced by:
-
Content relevance
-
Frequency
-
Audience targeting
-
Promotional intensity
Timing improves engagement — but poor messaging drives list loss.
Send-Time Performance Insights
Beyond day-of-week patterns, time-of-day behavior reveals even stronger optimization opportunities.
Here are three key takeaways to keep in mind:
-
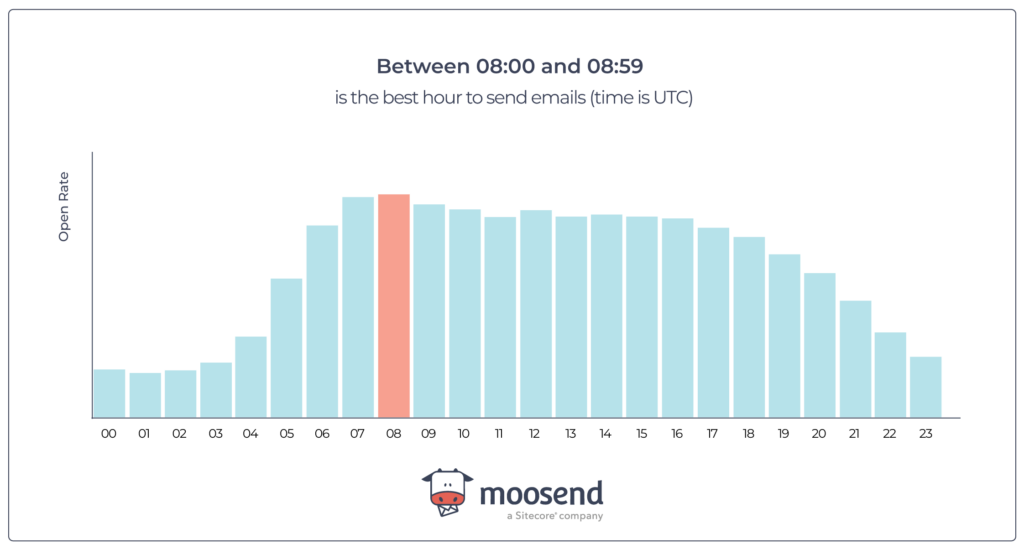
The highest open rates occur between 08:00 and 09:00, making it the optimal window to send campaigns.
-
Audiences often check email first thing in the morning.
-
Messages sent during this window appear near the top of the inbox during peak activity.
-
-
Emails sent before 05:00 see the lowest engagement, suggesting audiences aren’t active then.
-
Overnight sends risk getting buried beneath morning inbox volume.
-
Early-morning batch sends from multiple brands increase competition.
-
-
Open rates remain fairly strong from late morning until around 17:00 UTC, then gradually decline into the evening.
-
Workday attention sustains engagement.
-
After 6 PM, personal time and entertainment platforms compete for attention.
-
But what happens with the send time of your campaigns? Look at the graph below to get a better grasp.
Strategic Timing Recommendations for 2026
-
B2B: Tuesday–Thursday between 08:00–10:00 (recipient’s local time)
-
Ecommerce: Test Sunday evenings or Tuesday mornings
-
Global audiences: Segment by time zone — never blast at one universal time
-
Automated flows: Use behavior-triggered sends instead of fixed scheduling when possible
The Bigger Insight
Day-of-week differences are moderate.
Time-of-day differences are more impactful.
But the most important factor remains relevance.
The best-performing campaigns in 2026 combine:
-
Industry-aware benchmarking
-
Regional optimization
-
Smart timing
-
Personalized content
-
Clean lists
Timing enhances performance — it does not replace strategy.
How to Improve Your Email Metrics in Simple Steps
Benchmarks tell you where you stand.
Optimization tells you how to move forward.
Improving email performance in 2026 isn’t about tricks — it’s about refining relevance, deliverability, and audience alignment. Below are practical, data-backed ways to improve the four core metrics that directly impact your results.
1. Open Rate
Your open rate reflects subject line strength, sender reputation, timing, and audience trust.
How to improve it:
✔ Refine Subject Lines Strategically
-
Keep them under 40–50 characters for mobile visibility.
-
Use specificity instead of vague hype.
-
Introduce urgency carefully (without spam triggers).
-
A/B test curiosity vs. benefit-driven phrasing.
Instead of:
“Big News Inside”
Try:
“Your February Performance Report Is Ready”
Clarity consistently outperforms cleverness.
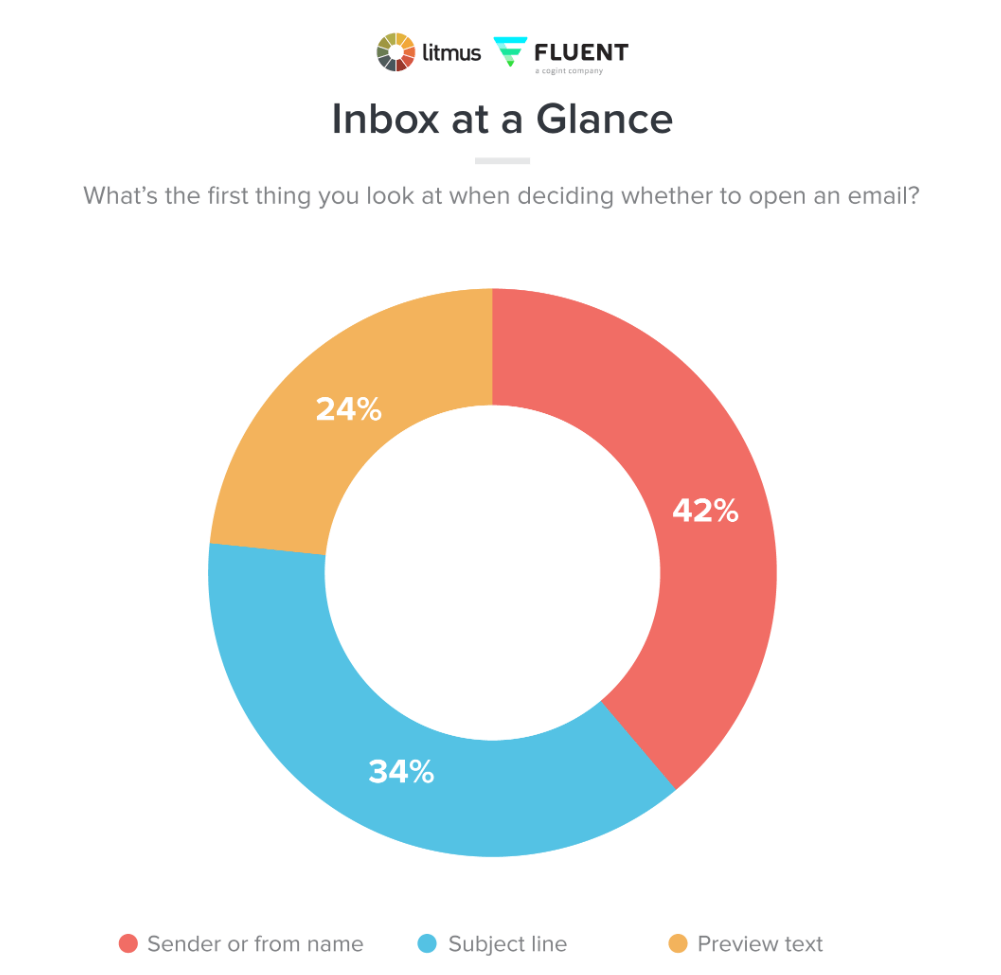
✔ Optimize Preheader Text
The preview line acts as a secondary headline. Use it to:
-
Reinforce the benefit
-
Add context
-
Overcome hesitation
Avoid repeating the subject line.
✔ Improve Sender Identity
Recipients open emails from senders they recognize.
-
Keep your “From” name consistent.
-
Avoid sudden brand name changes.
-
Use a real-person format when appropriate (e.g., “Emma from [Brand]”).
✔ Send at the Right Time
Based on engagement data:
-
08:00–09:00 local time performs strongest.
-
Early morning (before 05:00) performs weakest.
Segment by time zone when emailing international audiences.
✔ Clean Your List Regularly
Inactive subscribers drag down open rates.
Suppress or re-engage contacts who haven’t opened in 90–180 days.
List hygiene alone can significantly increase your reported open rate.
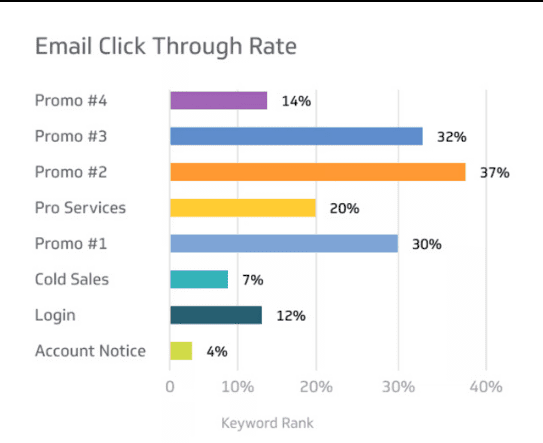
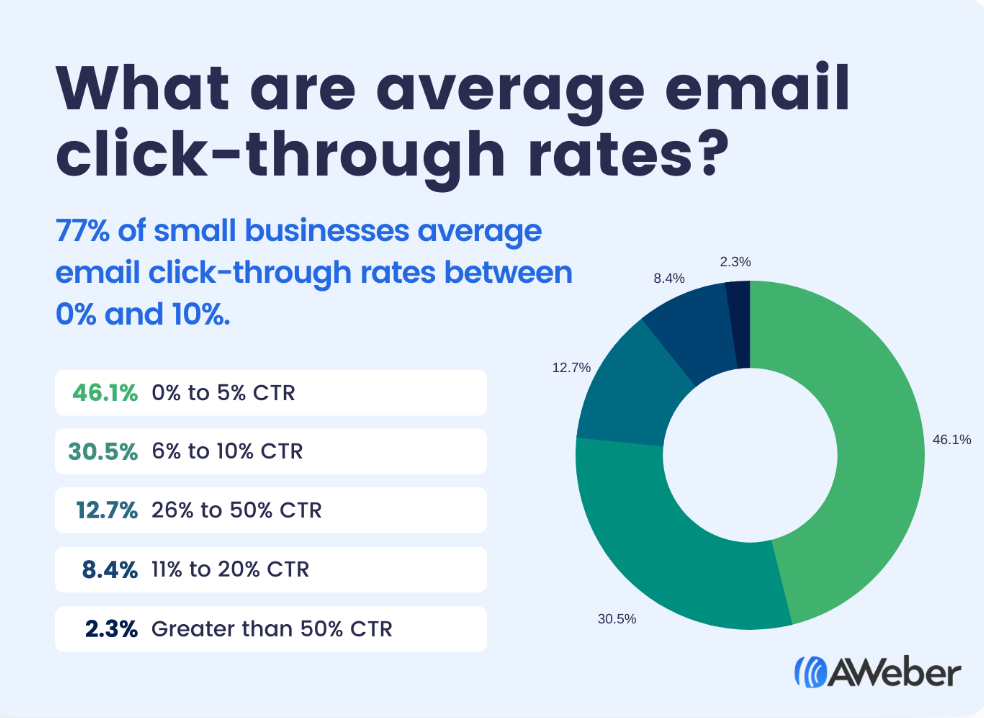
2. Email Click-Through Rate (CTR)
CTR measures content effectiveness and alignment between subject line promise and email body.
How to improve it:
✔ Focus on One Primary Goal
Too many CTAs reduce action.
Each campaign should have one dominant objective.
Make your main button:
-
Visually distinct
-
Above the fold
-
Action-oriented (“Download the Guide” > “Click Here”)
✔ Improve Content Relevance Through Segmentation
Segment by:
-
Purchase behavior
-
Engagement history
-
Geographic region
-
Industry or interest
The more relevant the content, the higher the clicks.
✔ Use Clear Visual Hierarchy
Structure emails with:
-
Short paragraphs
-
Subheadings
-
Bullet points
-
Buttons spaced properly
Mobile readability is essential in 2026.
✔ Match Offer to Audience Intent
Educational content boosts CTR in B2B.
Promotional incentives boost CTR in ecommerce.
Story-driven emails increase engagement in nonprofit sectors.
CTR improves when the content matches the subscriber’s expectations.
3. Bounce Rate
Bounce rate affects deliverability and sender reputation. High bounce rates can damage inbox placement.
There are two types:
-
Soft bounce: Temporary issue (full inbox, server delay)
-
Hard bounce: Invalid or non-existent email address
How to reduce bounce rate:
✔ Use Double Opt-In
This confirms email validity before adding subscribers to your list.
✔ Verify Emails at Collection
Use real-time validation in signup forms to catch typos like:
-
gmial.com
-
yaho.com
Prevention is better than cleanup.
✔ Remove Inactive & Invalid Contacts
If bounce rates exceed:
-
2% (regional average)
-
0.5% in strict B2B sectors
You likely need database cleaning.
Suppress addresses that hard bounce immediately.
✔ Monitor Domain-Level Issues
High bounce spikes may signal:
-
ISP blocking
-
Domain authentication errors (SPF, DKIM, DMARC)
-
Sending reputation problems
Deliverability health checks should be quarterly, minimum.
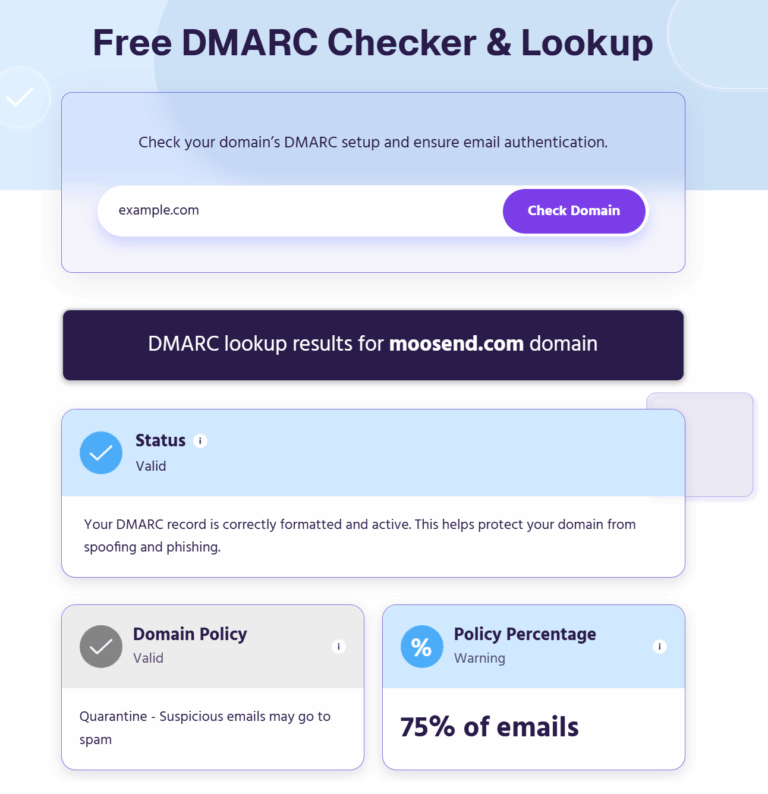
In terms of DMARC, you can use a DMARC checker to ensure it has been set up correctly.
4. Unsubscribe Rate
Unsubscribes are natural — but high unsubscribe rates signal audience misalignment or content fatigue.
Healthy unsubscribe rates generally fall between 0.1%–0.2%.
How to lower them:
✔ Reduce Sending Frequency for Cold Segments
High-frequency campaigns drive list fatigue.
Consider sending fewer emails to low-engagement subscribers.
✔ Set Expectations at Signup
Clearly state:
-
Email frequency
-
Type of content
-
Benefits
When expectations match reality, unsubscribe rates drop.
✔ Improve Personalization
Use:
-
First-name personalization (sparingly)
-
Behavior-based recommendations
-
Location-based offers
Generic email blasts increase churn.
✔ Offer a Preference Center
Instead of “Unsubscribe,” offer:
-
Reduce frequency
-
Switch content type
-
Pause emails temporarily
Giving control reduces total list loss.
Look at the example below by Headspace:

Final Optimization Insight
Improving email metrics isn’t about manipulating numbers.
It’s about improving:
-
Audience quality
-
Message clarity
-
Timing precision
-
Content relevance
When you consistently benchmark your performance against your industry and region, you stop guessing — and start optimizing strategically.
Small improvements compound.
A 2% lift in open rate combined with a 0.5% lift in CTR can dramatically increase revenue over time.
In email marketing, precision beats volume every time.
Additional Email Marketing Benchmarks
Open rates and CTRs measure engagement.
But the real business impact of email marketing is reflected in conversion, revenue, growth, and ROI.
These advanced benchmarks help you connect campaign performance directly to profitability.
Conversion Rate
Conversion rate measures the percentage of recipients who complete a desired action after clicking — such as making a purchase, registering for a webinar, or downloading a resource.
Unlike CTR, conversion rate reflects bottom-of-funnel effectiveness.
Here are average conversion rates across selected industries:
| Industry | Average Conversion Rate |
|---|---|
| Retail | 0.07% |
| Automotive | 0.06% |
| Computers & Electronics | 0.04% |
| Food & Beverage | 0.17% |
| Home & Garden | 0.05% |
| Health & Beauty | 0.11% |
| Jewellery | 0.05% |
| Office Supplies | 0.08% |
| Specialty Retail | 0.09% |
| Sports | 0.06% |
| Hobbies & Leisure (Toys & Hobbies) | 0.09% |
What This Conversion Data Reveals
-
Food & Beverage (0.17%) leads significantly.
Consumable products drive faster buying decisions and repeat purchases. -
Health & Beauty (0.11%) performs above retail averages.
This category benefits from subscription models and strong brand loyalty. -
Computers & Electronics (0.04%) lags behind.
High-ticket items typically require longer consideration cycles. -
Retail averages remain modest (0.07%).
Volume-based strategies and segmentation are critical for profitability.
Even small percentage changes matter.
Improving conversion from 0.07% to 0.10% can represent a major revenue increase at scale.
List Growth Rate
List Growth Rate measures how fast your subscriber base expands after subtracting unsubscribes and bounces.
Healthy annual list growth typically ranges between:
-
5%–10% organically
-
15%–25% with aggressive lead generation
If your unsubscribe + bounce rate equals or exceeds new subscriber acquisition, your email program is stagnating.
To maintain positive growth:
-
Use gated content and lead magnets.
-
Optimize signup forms for mobile.
-
Leverage referral and loyalty programs.
-
Run re-engagement campaigns before removing inactive contacts.
Without steady growth, long-term revenue plateaus.
Revenue per Email (RPE)
Revenue per Email measures how much revenue each sent email generates on average.
Formula:
Revenue ÷ Total Emails Sent
In ecommerce, strong programs often achieve:
-
$0.05–$0.25 per email for standard campaigns
-
$0.30–$1.00+ per email for automated flows (abandoned cart, post-purchase)
Automated lifecycle emails consistently outperform newsletters because they are behavior-triggered.
If your RPE is low:
-
Improve segmentation
-
Enhance product recommendations
-
Focus on high-intent automation flows
RPE is one of the most actionable profitability metrics.
Return on Investment (ROI)
Email marketing continues to deliver one of the highest ROIs among digital channels.
Industry-wide ROI estimates commonly range from:
-
$30–$40 return per $1 spent
However, ROI depends heavily on:
-
Automation maturity
-
Deliverability health
-
Personalization depth
-
Customer lifetime value
Email remains powerful because:
-
You own your audience.
-
There are no rising ad auction costs.
-
It scales without proportional cost increases.
Strategic Insight
Top-performing email programs don’t optimize just for opens or clicks.
They focus on:
-
Conversion rate improvement
-
List quality growth
-
Revenue per send
-
Lifecycle automation
-
Long-term ROI
Engagement metrics show interest.
Revenue metrics show impact.
In 2026, email marketing success isn’t defined by vanity metrics — it’s defined by measurable business outcomes.
Using Email Marketing Benchmarks
Monitoring email marketing benchmarks allows you to evaluate how your campaigns truly perform — not just in isolation, but against your industry standards and regional trends. When you understand how metrics vary by sector, geography, and even day or time of sending, you can make smarter scheduling and strategic decisions instead of relying on assumptions.
That said, benchmarks are reference points — not universal rules. Every audience behaves differently. To maximize results, analyze your buyer personas, engagement history, and purchasing behavior in depth. Use segmentation and behavioral data to align your messaging with real subscriber habits rather than generic averages.
Testing should remain a continuous process. A/B test subject lines, send times, content formats, and calls-to-action regularly. Performance improvements often come from incremental refinements rather than drastic changes. The goal is ongoing optimization until you clearly identify what resonates most with your specific audience.
If you’re looking for a powerful email automation platform with advanced reporting and analytics capabilities, consider starting a free trial with Teno Mail to streamline your campaigns and track performance more effectively.
Email Marketing Benchmark FAQs
Below are answers to the most common benchmark-related questions marketers ask when evaluating their email performance in 2026.
1. What is a good email open rate?
A “good” open rate depends heavily on your industry and region.
Based on current benchmark data:
-
Industry averages range from ~21% to 40%
-
Global regional average sits around 19–25%
-
Top-performing sectors (e.g., nonprofit, hobbies, government) exceed 38–40%
As a general reference:
-
20–25% = Average across most industries
-
25–35% = Strong
-
35%+ = Excellent (often niche or highly engaged audiences)
However, open rate alone does not determine success. Privacy changes and email client tracking adjustments have made open tracking less precise. Always evaluate open rate alongside CTR and conversions.
2. What is a good CTR in email marketing?
Click-Through Rate (CTR) measures how many recipients click after receiving your email.
Current benchmarks show:
-
Global average CTR: ~2%
-
High-performing industries: 3%–3.5%+
-
B2B or technical industries: often 1.5%–2.5%
As a rule of thumb:
-
2% = Healthy baseline
-
3%+ = Strong engagement
-
Below 1.5% = Likely needs optimization
CTR reflects content quality, CTA placement, and relevance. If opens are strong but CTR is weak, your email body may not match the subject line’s promise.
3. How can I improve my email open rates?
To improve open rates, focus on three key areas:
1. Subject Line Optimization
-
Keep it concise (under 50 characters)
-
Use specificity over vague language
-
Avoid excessive promotional wording
2. Sender Trust
-
Maintain a consistent “From” name
-
Warm up new domains before large sends
-
Authenticate emails properly (SPF, DKIM, DMARC)
3. Timing & Segmentation
-
Send between 08:00–09:00 local time for best results
-
Segment inactive subscribers
-
Remove long-term non-openers
Often, improving list quality alone can raise open rates by several percentage points.
4. What is a good unsubscribe rate?
A healthy unsubscribe rate typically falls between:
-
0.1%–0.2%
Industry data shows most sectors average around 0.10%–0.18%.
If your unsubscribe rate exceeds:
-
0.25% consistently, you may be over-emailing or misaligned with audience expectations.
Unsubscribes are normal. In fact, a small unsubscribe rate can help clean your list and improve engagement metrics over time.
5. What is an acceptable bounce rate in email marketing?
Bounce rate directly impacts deliverability and sender reputation.
Benchmarks show:
-
Global average: ~2–3% (regional data)
-
Industry averages: often below 0.5%
-
B2B sectors may experience slightly higher rates due to job turnover
General guidelines:
-
Below 2% = Healthy
-
2–3% = Monitor closely
-
Above 3% = Requires immediate list cleaning
-
Above 5% = Serious deliverability risk
High bounce rates are usually caused by:
-
Outdated databases
-
Purchased lists
-
Lack of email verification
-
Infrequent cleaning
Removing hard bounces immediately and verifying new subscribers at signup are essential for maintaining inbox placement.
Read More: 10 Email Automation Examples To Increase Sales In 2026